VoxMetria software is designed for Speech-Language Pathologists to analyze speech and voice. It includes a variety of functions and parameters allowing the clinician to record, analyze and play speech samples. Two special features called Comparison and Follow-up enable clinical results to be viewed by selecting past sessions and other voice models for comparison in multiple displays, helping clinician and patient during the evaluation and treatment processes.
Main Advantages
- Easy to use
- Fast, dynamic and precise acoustic analysis.
- Powerful Educational Resource for the clinician and the patient.
- Clear intelligible graphs.
- Ability to see side-by-side comparisons.
- Phonatory deviation graphs showing voice deviation.
Main Features:
Voice Analysis Functions
Audio Signal
This screen shows a time-intensity display of a sound file with clear color of the areas with and without laryngeal voicing.
Fundamental Frequency and Intensity
This graph displays fundamental frequency (Hz) and intensity (dB) of a sustained vowel over time. Fo, intensity and timing (seconds) are displayed by moving the mouse on any point of the graph.

F0 Histogram
This screen shows the Fundamental Frequency Histogram, which displays the frequency distribution into bar graphs.
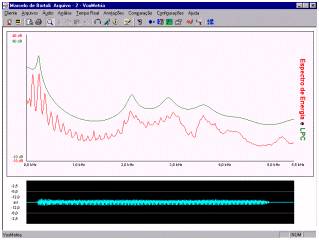
LPC and Power Spectrum
This graph displays the formants by two different calculations: LPC (Linear Predictive Coding) and FFT (Fast Fourier Transformation). While LPC shows the envelope of the spectrum, the FFT is based on harmonics of the sounds
Vowel Space
This graph displays a plot of F1 and F2 commonly referred to as the vowel quadrilateral.
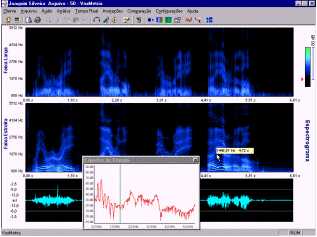
Spectrogram
This screen offers the spectrogram trace both in wide and narrow band, so that the formants and the sound harmonics can be conveniently compared. There is a special feature that allows changing sound gain by sliding the ruler on the top right hand side of the screen. By this analysis, we can understand glottic adduction, vocal resonance and speech articulation.
Statistics
A variety of statistical measures are available at a glance by selecting a statistical analysis.

Vocal Quality Functions
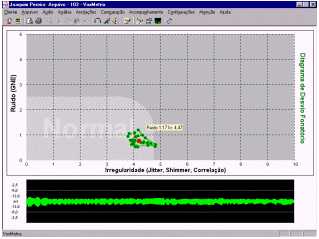
Phonatory Deviation Diagram
This screen shows a simple and straightforward graph, which ranks the client’s production inside a normal or altered area by means of a little red circle, which indicates the average value and smaller green circles, which show the irregularity distribution, particularly concerning phonatory deviation; it enables brief and precise information on the quality of the client’s production.
Statistics
This screen displays the acoustic analysis values of fundamental frequency, jitter, shimmer, irregularity, noise rate and GNE.

Spectrogram, F0 and Intensity
This graph displays a spectrogram trace in narrow-band with fundamental frequency and intensity plot chart.

Notes Editor
A text editor is available allowing the clinician to make notes concerning any part of the analysis.
Real Time
The real time analyses play a recorded sound file and display the graph as you hear the speaker talk.
Comparison and Follow up
The comparison screen allows the analysis of concomitant data from two files applying the functions of the voice analysis and vocal quality, enabling clinician and client to see, listen and discuss the differences between the two voice outputs and also to follow the treatment process.
In a quality vocal session, it is possible to follow the progress including several different files in the same Phonatory Deviation Diagram.

Reports
All graphs can easily be printed.

vox metria, praat, vox, voice analysis, shimmer, jitter, vocal evalution Mara behlau, dr. speech, voice, vocal quality, voice analysis software, hoarseness
Download Free Evaluation Version: